The article reveals the indicators of Laser Doppler Flowmetry of the tooth pulp and densitometry in young people aged 20-30, with dentine caries. 106 teeth of the chewing group of the upper and lower jaw were examined (30 intact teeth and 86 teeth with dentin caries). The indicators of Laser Doppler Flowmetry of the tooth pulp and densitometry of teeth affected by dentine caries (class II according to Black) were determined. A significant decrease in the densitometric parameters of the dentin of teeth affected by caries, as well as a significant increase in the parameters of Laser Doppler Flowmetry of the tooth pulp in dentin caries, was determined. According to the data of Laser Doppler Flowmetry of the tooth pulp, an improvement in blood circulation parameters was determined in both groups. However, in group 1, the indicators were unreliable, and in group 2, after 12 months, the level of capillary blood flow (M) improved by 1.3 times, the intensity of blood flow (σ) increased by 1.5 times, the vasomotor activity of microvessels (KV) - by 1.9 times, and also approached the norm.
Introduction
Currently, dental caries affects almost the entire population of the planet, which determines its not only clinical but also social significance [1-3]. In Russia, the prevalence of caries among the adult population, depending on the region, ranges from 80% to 100% [4]. Despite the successes achieved in the treatment and prevention of caries, the percentage of its complications remains high [5, 6]. The treatment of caries depends on the nature of changes in the hard tissues of the tooth and pulp. Currently, the problem of dental caries treatment has not been completely solved [7].
The use of classical forms of caries diagnosis is not always effective and informative enough. Various methods are used for additional diagnosis of caries: X-ray, electrodontometric, transilluminative, densitometric, and others [8-11].
X-ray examination is an important additional method of diagnosing caries and its complications [12, 13]. In some cases, an X-ray image can reveal a carious lesion in the complete absence of its clinical manifestations [14]. The carious lesion of dentin on the X-ray looks like an area of enlightenment in the corresponding area of the tooth crown [15, 16]. The absence of a defect in the hard tissues of the tooth on the X-ray is not a 100% guarantee that there is no carious lesion in this tooth [14]. This is because the diagnostic information content of X-ray (including radiovisiographic) examination is limited in some cases [17, 18]. This method does not allow for the identification of carious lesions of the enamel, in addition, difficulties may arise with carious lesions of the surface layers of the dentin of the tooth, as well as when superimposing images of teeth on each other [19, 20].
Another method of diagnosing latent caries is transillumination – the translucence of the tooth crown with a bright light stream [21, 22]. In this case, the foci of carious lesions form a shadow visible when examining the tooth from the opposite side [23, 24]. The most effective use of this technique in the study of the frontal group of teeth makes it possible to identify enamel cracks and assess the condition of tooth tissues around previously applied fillings, but if caries affects the lateral teeth, transillumination is not so effective [25, 26].
The method of objective analysis of the optical density of tooth tissues for the diagnosis of hidden foci of carious lesions is based on the analysis of the optical properties of tooth tissues when irradiated with pulsed laser radiation [27, 28]. The detection of foci of carious lesions is based on the fact that in these areas there is a change in the optical properties of tooth tissues. The device allows to assessment of the condition of tooth tissues that are inaccessible during probing and visual examination [29]. It allows you to diagnose latent fissure and approximal caries, recurrent caries along the edge of the filling, as well as identify and control the dynamics of foci of enamel demineralization. The disadvantage of the method is the high cost of the device [30-35].
Electrodontometry is also used to diagnose caries, based on determining the threshold of pulp sensitivity to electric current [36]. The disadvantage of the method is that the digital indicators of the result depend on the patient's age, his mental state, the excitability of his nervous system; on strict observance of the basics of electrometric research. Electrodontometry allows for a quantitative assessment but is not an objective method [37-41].
An important diagnostic method is the densitometric method, which combines various methods of image acquisition, its quantitative analysis, the main task of which is to determine the mineral density of the bone tissue of the object [42]. The advantages of densitometric radiovisiography are high sensitivity, computer data processing, fast image acquisition on the monitor, and the ability to identify and isolate tissues of the same density using color saturation [43]. Optical densitometry provides an objective assessment of the results and effectiveness of the treatment [44]. To analyze the data of densitometry of dental tissues affected by caries, it is necessary to have comparative indicators of the norm that we determined earlier [45].
In recent years, with the introduction of new technologies, it has become possible to assess the hemodynamics of blood flow in tissues, including in the tooth pulp by Laser Doppler Flowmetry (LDF) [46]. Laser Doppler Flowmetry provides a detailed analysis of the state of microcirculation in the area of the pathological focus, based on the isolation of rhythmic components of hemodynamic flows in tissues [47]. This method allows us to obtain maximum information about violations of the regulatory mechanisms of blood flow in the microcirculatory bed, which are subject to correction [48]. Having a high sensitivity to changes in microhemodynamics, the Laser Doppler Flowmetry method has an undeniable advantage over other methods of studying microcirculation, since it allows us to assess the state of functioning of blood flow control mechanisms [49]. In this regard, the study of Laser Doppler Flowmetry indicators of dental pulp is an urgent problem in practical dentistry [50-55].
The purpose of the study. Determination of the parameters of Laser Doppler Flowmetry of the tooth pulp and densitometry in young people with dentine caries.
Materials and Methods
The study was conducted on young patients aged 21-30 years who applied to the state budgetary healthcare institution Dental Polyclinic in Nalchik (Republic of Kabardino-Balkaria, Russia), with dentine caries, grade II in Black and a low caries prevalence index [56, 57].
Based on the clinical examination, two groups were formed: a control group, where the dentin of 30 intact teeth was examined, and a main group, in which 86 teeth with dentin caries were examined [58-68].
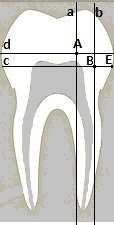
Densitometric studies were performed on RVG images. The densitometric parameters of intact teeth were determined at points A and B. Point A is located at the intersection of a straight line d passing 1.5 mm above the tops of the pulp horns perpendicular to the axis of the tooth and a straight line passing vertically along the top of the pulp horn [69]. Point B is located at the intersection of a straight line with a parallel straight-line d 1.5 mm below the vertices of the pulp horns and a straight line b running perpendicular to the straight line c between the straight line a and point E, which is the border of the tooth (Figure 1). The data of the densitometric indicators at point A were 132.5 ± 3.7 conventional units at point B 136.8±4.4 conventional units, which we took as normal indicators.
|
|
|
Figure 1. Image of schematic points of dentin density of intact teeth |
The microcirculation of the tooth pulp was studied using a computerized laser analyzer of capillary blood flow LAKK-02 (Russia). Before examining the microcirculation of the tooth pulp, hardware compensation of the signal level due to the color of the tooth and affecting the magnitude of the signal received directly from the pulp was performed. To do this, a light guide in a black elastic nozzle was installed in the upper third of the crown of the tooth under study and a biological zero was obtained in the device by automatic subtraction [70, 71]. After that, the light guide probe was installed perpendicular to the buccal surface of the tooth in the cervical region 2 mm above the gingival margin in the zone of the crown part of the pulp [67, 72, 73]. The installation of a light guide probe was carried out without pronounced pressure on the tooth to avoid the reaction of periodontal vessels closely related to the vascular system of the tooth pulp. A useful signal of fluctuations in blood flow in the microcirculatory bed of the pulp was found, an LDF gram was recorded for 3-5 minutes and its subsequent processing was carried out automatically. After registering the LDF-grams, the average statistical values of the flowmetry (signal amplitudes at the output of the device) are displayed on the monitor: the value of the average blood perfusion flow (M) in the registration time interval, the standard deviation (σ) and the integral index of variations (KV) of this process. Statistical processing was performed in the Statistica v.12.0 software package.
Results and Discussion
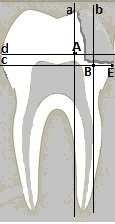
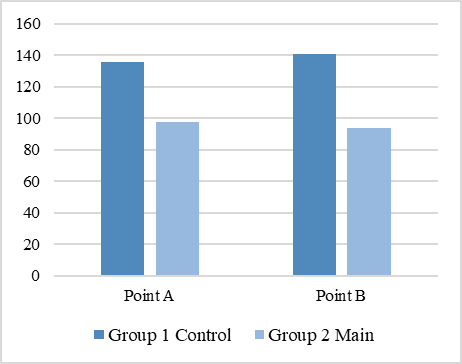
Densitometric indicators of teeth affected by dentin caries, according to class II, were also determined at points A and B (Figure 2). At point A, the indicators were 98.9 ± 1.6 conventional units, and at point B - 95.8± 2.0 conventional units (Figure 3). The data obtained indicate a significant decrease in densitometric parameters in dental caries compared with normal values (p 0.01).
|
|
|
Figure 2. Image of schematic points of dentine density of teeth affected by caries |
|
|
|
Figure 3. Indicators of dentin densitometry of teeth affected by caries |
The indicators of microcirculation and rhythmic components of the amplitude-frequency spectrum of LDF-grams are shown in Table 1.
Table 1. Indicators of microcirculation and rhythmic components of the amplitude-frequency spectrum of LDF-grams
|
Patient groups |
LDF-gram indicators (conditional units) |
|
|
Control |
М |
1.3±0.07 |
|
σ |
0.11±0.03 |
|
|
KV |
5.7±0.12 |
|
|
Main |
М |
1.78±0.42* |
|
σ |
0.16±0.03* |
|
|
KV |
8.13±1.23* |
|
Note: The reliability of the differences about the norm was p*<0.05; <0.01.
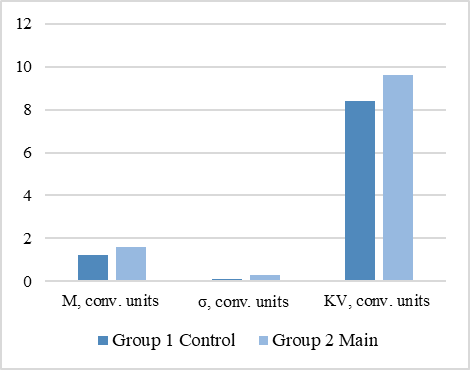
According to the table, it can be seen that in dentin caries, the level of capillary blood flow (M), blood flow intensity (σ), and vasomotor activity of microvessels (KV) is significantly higher compared with the indicators of intact teeth (Figure 4) [74, 75].
|
|
|
Figure 4. Indicators of microcirculation and rhythmic components of the amplitude-frequency spectrum of LDF-grams |
The examined patients had carious cavities with localization of cavities according to the II Black class. Short-term pain from mechanical and thermal stimuli was observed, which quickly passed after its elimination [76]. When probing, the soreness was noted throughout the bottom of the carious cavity, percussion was painless. The indicator of electrodontodiagnostics from the bottom of the carious cavity on the examined teeth with dentin caries was on average 11.8± 0.8 µA. Next, a densitometric study was performed. The criteria previously developed by us were taken as indicators of the norm, at point A – 132.5 ± 3.7 conventional units, and at point B – 136.8 ±4.4 conventional units. The dynamics of densitometric parameters of patients with dentin caries, depending on the treatment method, are shown in Table 2.
Table 2. Dynamics of dentin densitometric parameters in patients of groups 1 and 2, depending on the treatment method
|
Treatment status |
Normal indicators, conventional units |
Group 1 Control, conventional units |
Group 2 Main, conventional units |
|||
|
Point A |
Point B |
Point A |
Point B |
Point A |
Point B |
|
|
Before treatment |
132.5 ±3.7 |
136.8±4.4 |
96.6±3.1* |
95.7±2.2* |
96.8±3.3* |
95.8±2.0* |
|
6 months after treatment |
132.5 ±3.7 |
136.8±4.4 |
98.9±1.2** |
103.1±1.4** |
113.5±4.0** |
112.6±2.7** |
|
12 months after treatment |
132.5 ±3.7 |
136.8±4.4 |
103.1±1.4*** |
102.9±2.9*** |
130.5±4.1*** |
129.9±3.5*** |
Note: Reliability in relation to the indicators of the norm (p*>0.05). The reliability of the indicators compared with the initial data after treatment after 6 months (p**<0.05), and after 12 months (p***<0.01).
According to Table 2, it can be seen that in group 1, after 6 and 12 months, the densitometric parameters at points A and B changed slightly [77]. In group 2, there were significant changes in densitometric indicators: after 6 months at point A, they improved by 16.7±0.7 conventional units, at point B – by 16.8±0.7 conventional units; after 12 months at point A – by 33.7 ±0.8 conventional units, at point B – by 34.1 ±1.5 conventional units (p0.05; 0.01) and approached the indicators of the norm.
The dynamics of microcirculation and rhythmic components of the amplitude-frequency spectrum of LDF-grams in patients with dentin caries, depending on the treatment method, are reflected in Table 3 [78-82]. The following indicators were taken as normal: the level of capillary blood flow (M) within 1.31±0.07 conventional units, the intensity of blood flow (σ) – 0.11±0.03 conventional units, the vasomotor activity of microvessels (KV) within 5.71±0.12 conventional units [12, 13, 82-84]. According to Table 3, it can be seen that in group 1, changes in relation to the norm occur less pronounced than in group 2 – a significant improvement in Laser Doppler Flowmetry was determined after 12 months (p0.01).
Table 3. Indicators of microcirculation and rhythmic components of the amplitude-frequency spectrum of LDF-grams in patients with dentin caries of groups 1 and 2, depending on the treatment method
|
Treatment status |
Normal indicators |
Group 1 Control |
Group 2 Main |
||||||
|
М |
σ |
KV |
М |
σ |
KV |
М |
σ |
KV |
|
|
Before treatment |
1.31± 0.07 |
0.11± 0.03 |
5.71± 0.12 |
1.76±0.41* |
0.16±0.03* |
8.13±1.23* |
1.78±0.43* |
0.17±0.03* |
8.19±1.12* |
|
6 months after treatment |
1.31± 0.07 |
0.11± 0.03 |
5.71± 0.12 |
1.63±0.17** |
0.15±0.05** |
7.22±1.11** |
1.51±0.03** |
0.13±0.07** |
6.37±0.13** |
|
12 months after treatment |
1.31± 0.07 |
0.11± 0.03 |
5.71± 0.12 |
1.52±0.12*** |
0.14±0.06*** |
6.26±1.12*** |
1.36±0.06*** |
0.11±0.11*** |
4.31±0.09*** |
Note: Reliability in relation to the indicators of the norm (p*>0.05). The reliability of the indicators compared with the initial data after treatment after 6 months (p**<0.05), and after 12 months (p***<0.01).
According to the data of densitometric analysis using the method of radiovisiography, a decrease in indicators at point A was determined by 1.3 times, at point B by 1.4 times, which indicates a significant decrease in the density of dentin of teeth affected by caries [13, 15-17]. According to the LDF data, a significant increase in indicators was obtained by 1.4 times, which indicated an increase in tissue perfusion with blood and a violation in the microcirculatory bed of the tooth pulp [18, 23, 24]. The data obtained should be taken into account when choosing a treatment method and monitoring the therapy.
Conclusion
Based on the data of densitometric analysis, the improvement of indicators in both groups was determined. However, in group 1, the densitometric indicators increased unreliably, in group 2, after 6 months at points A and B, they increased by 1.2 times; after 12 months at points A and B, they increased by about 1.3 times and approached the norm. According to the data of Laser Doppler Flowmetry of the tooth pulp, an improvement in blood circulation parameters was determined in both groups. However, in group 1, the indicators were unreliable, and in group 2, after 12 months, the level of capillary blood flow (M) improved by 1.3 times, the intensity of blood flow (σ) increased by 1.5 times, the vasomotor activity of microvessels (KV) – by 1.9 times, and also approached the norm. Thus, the complex treatment of dentin caries using a preparation from brown algae and low-intensity laser radiation is effective, which is confirmed by the data of dentin densitometry and Laser Doppler Flowmetry of the tooth pulp.
Acknowledgments: None
Conflict of interest: None
Financial support: None
Ethics statement: The patients were given an explanation of the goals and objectives of the study; after which they gave written consent The study was approved by the Ethic Committee of institution (Protocol #7 dated by 07 Dec 2023).